Metrics to analyse overall AI governance progress
Saidot provides tools for the AI Governance Director, Governing Body or Auditors to analyse the AI Governance progress and quality against the set success metrics.
This information is provided through
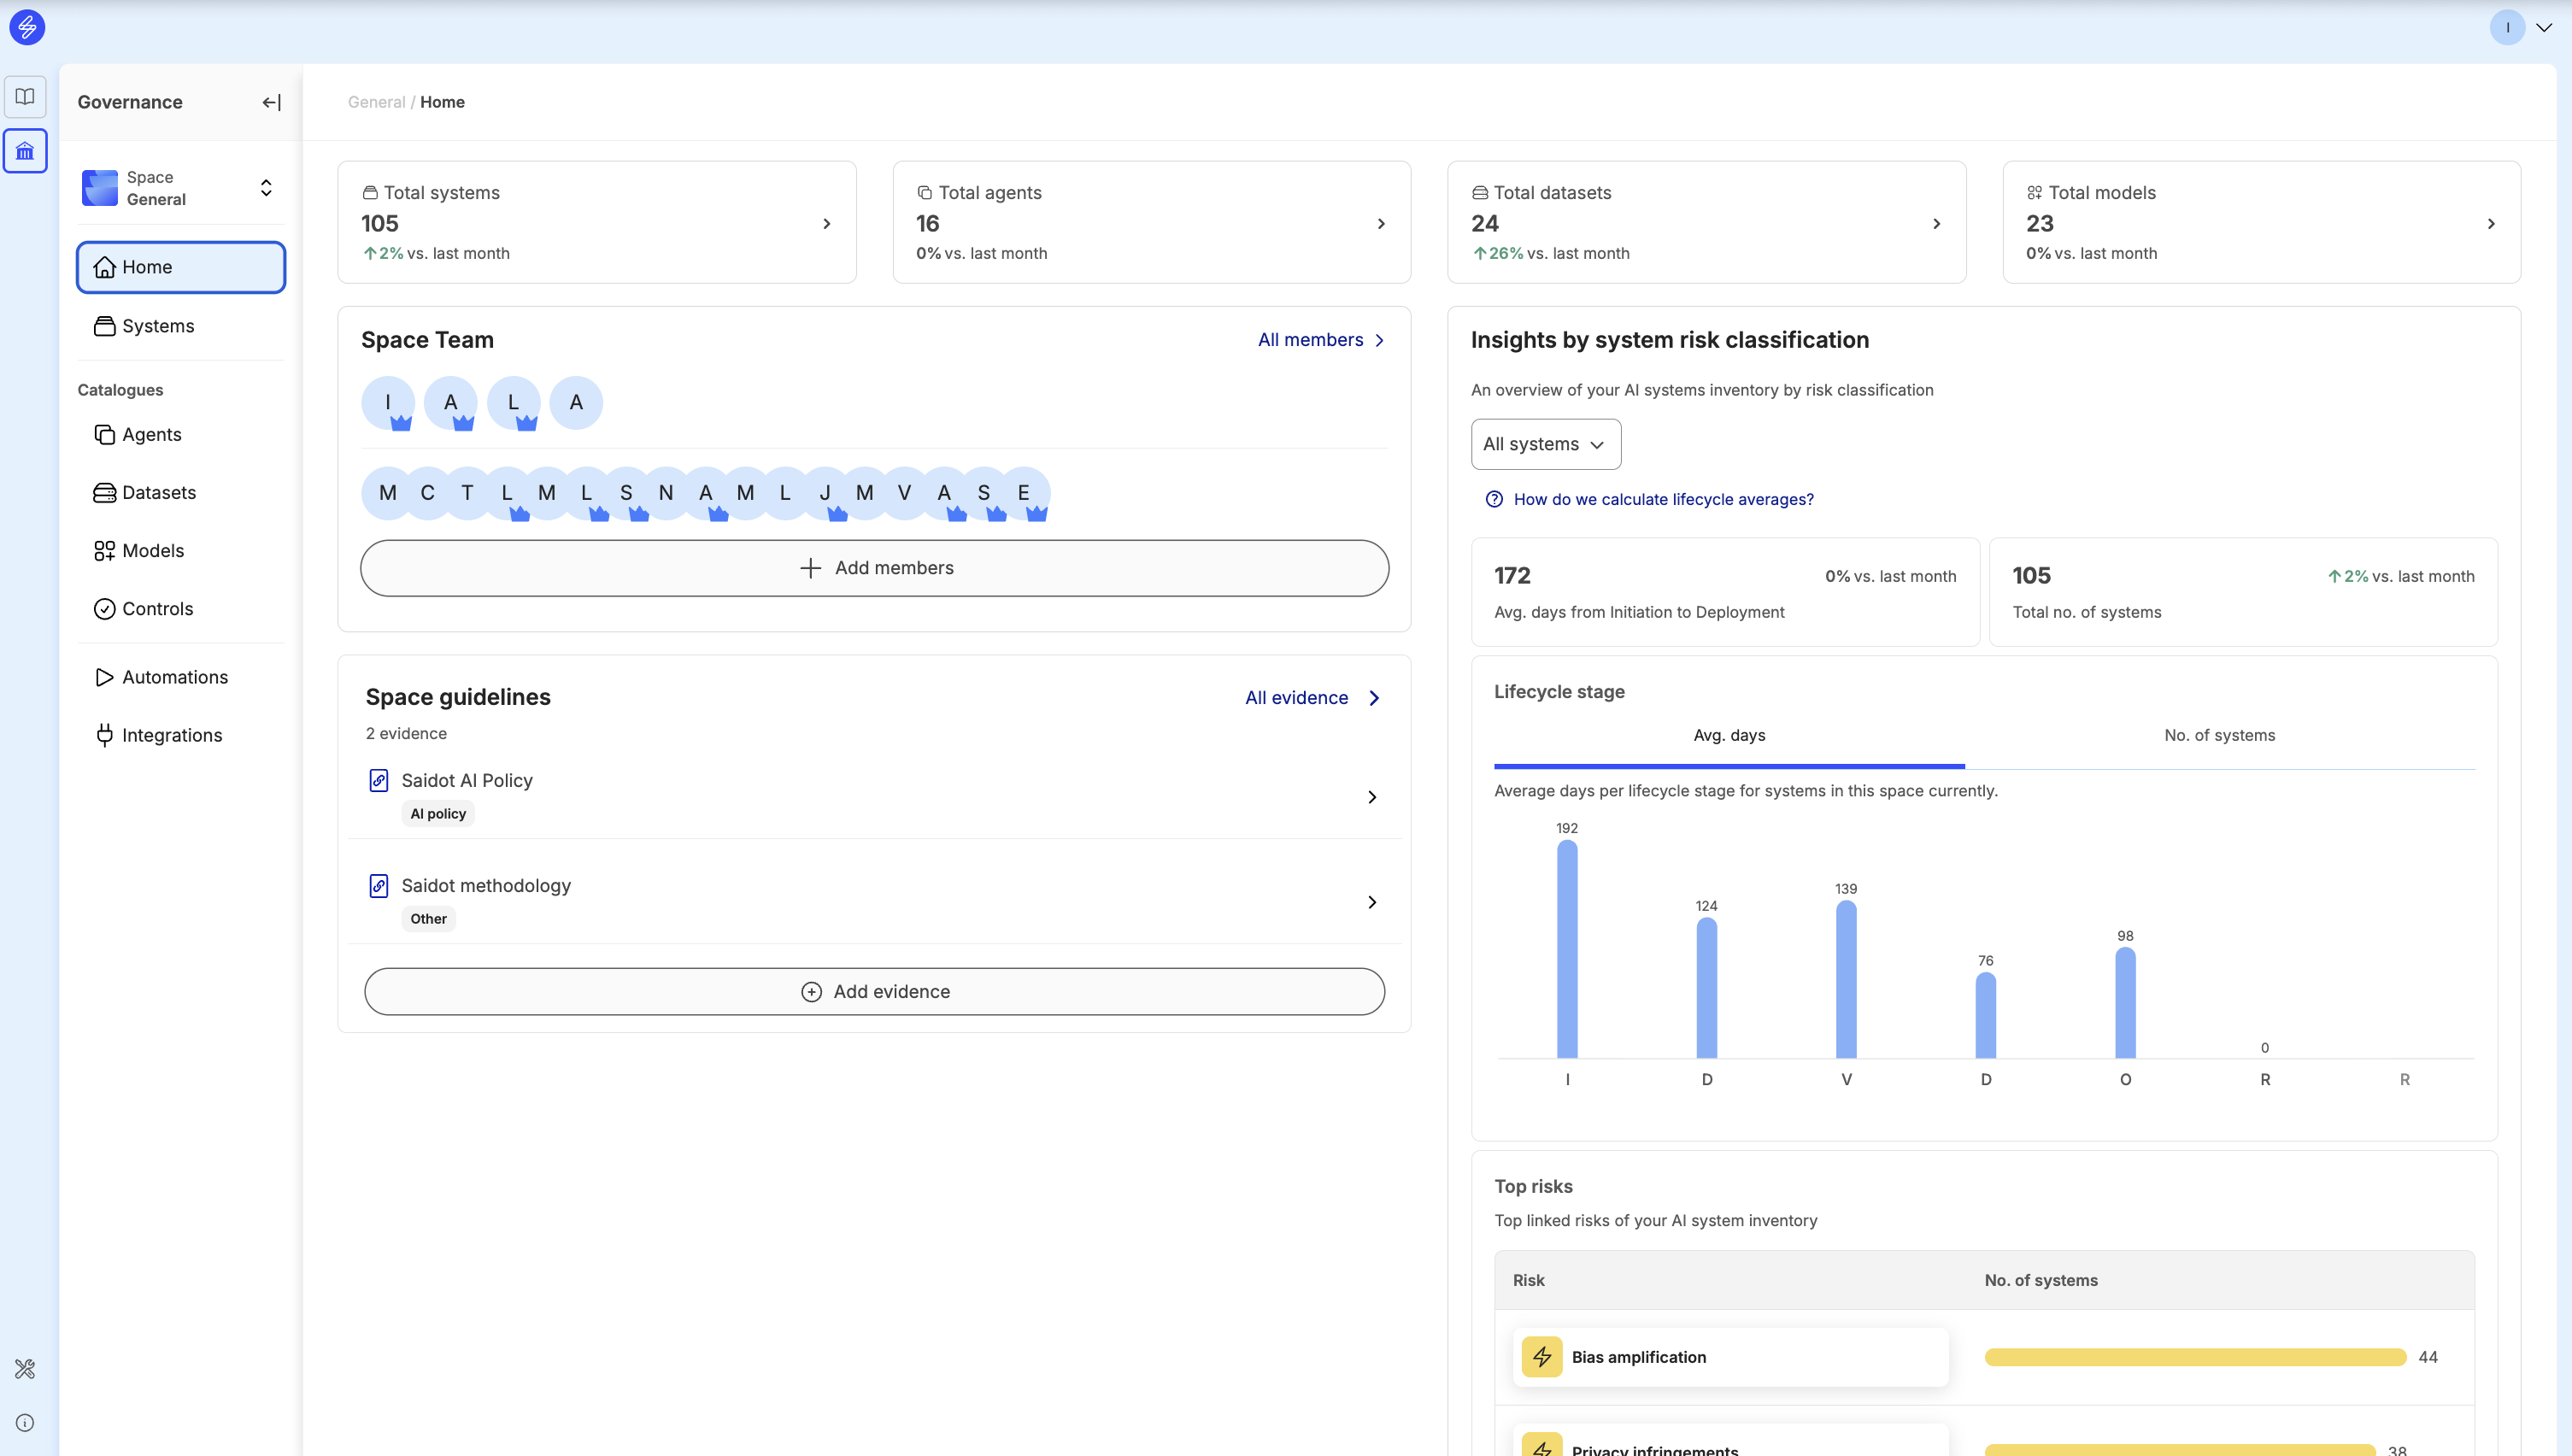
Metrics in Home screen
Home page includes insights about
-
AI systems in different risk levels and lifecycle phases
-
Average days per lifecycle stage
-
Number of AI systems, Models and Datasets in the Catalogues
-
The most common risks
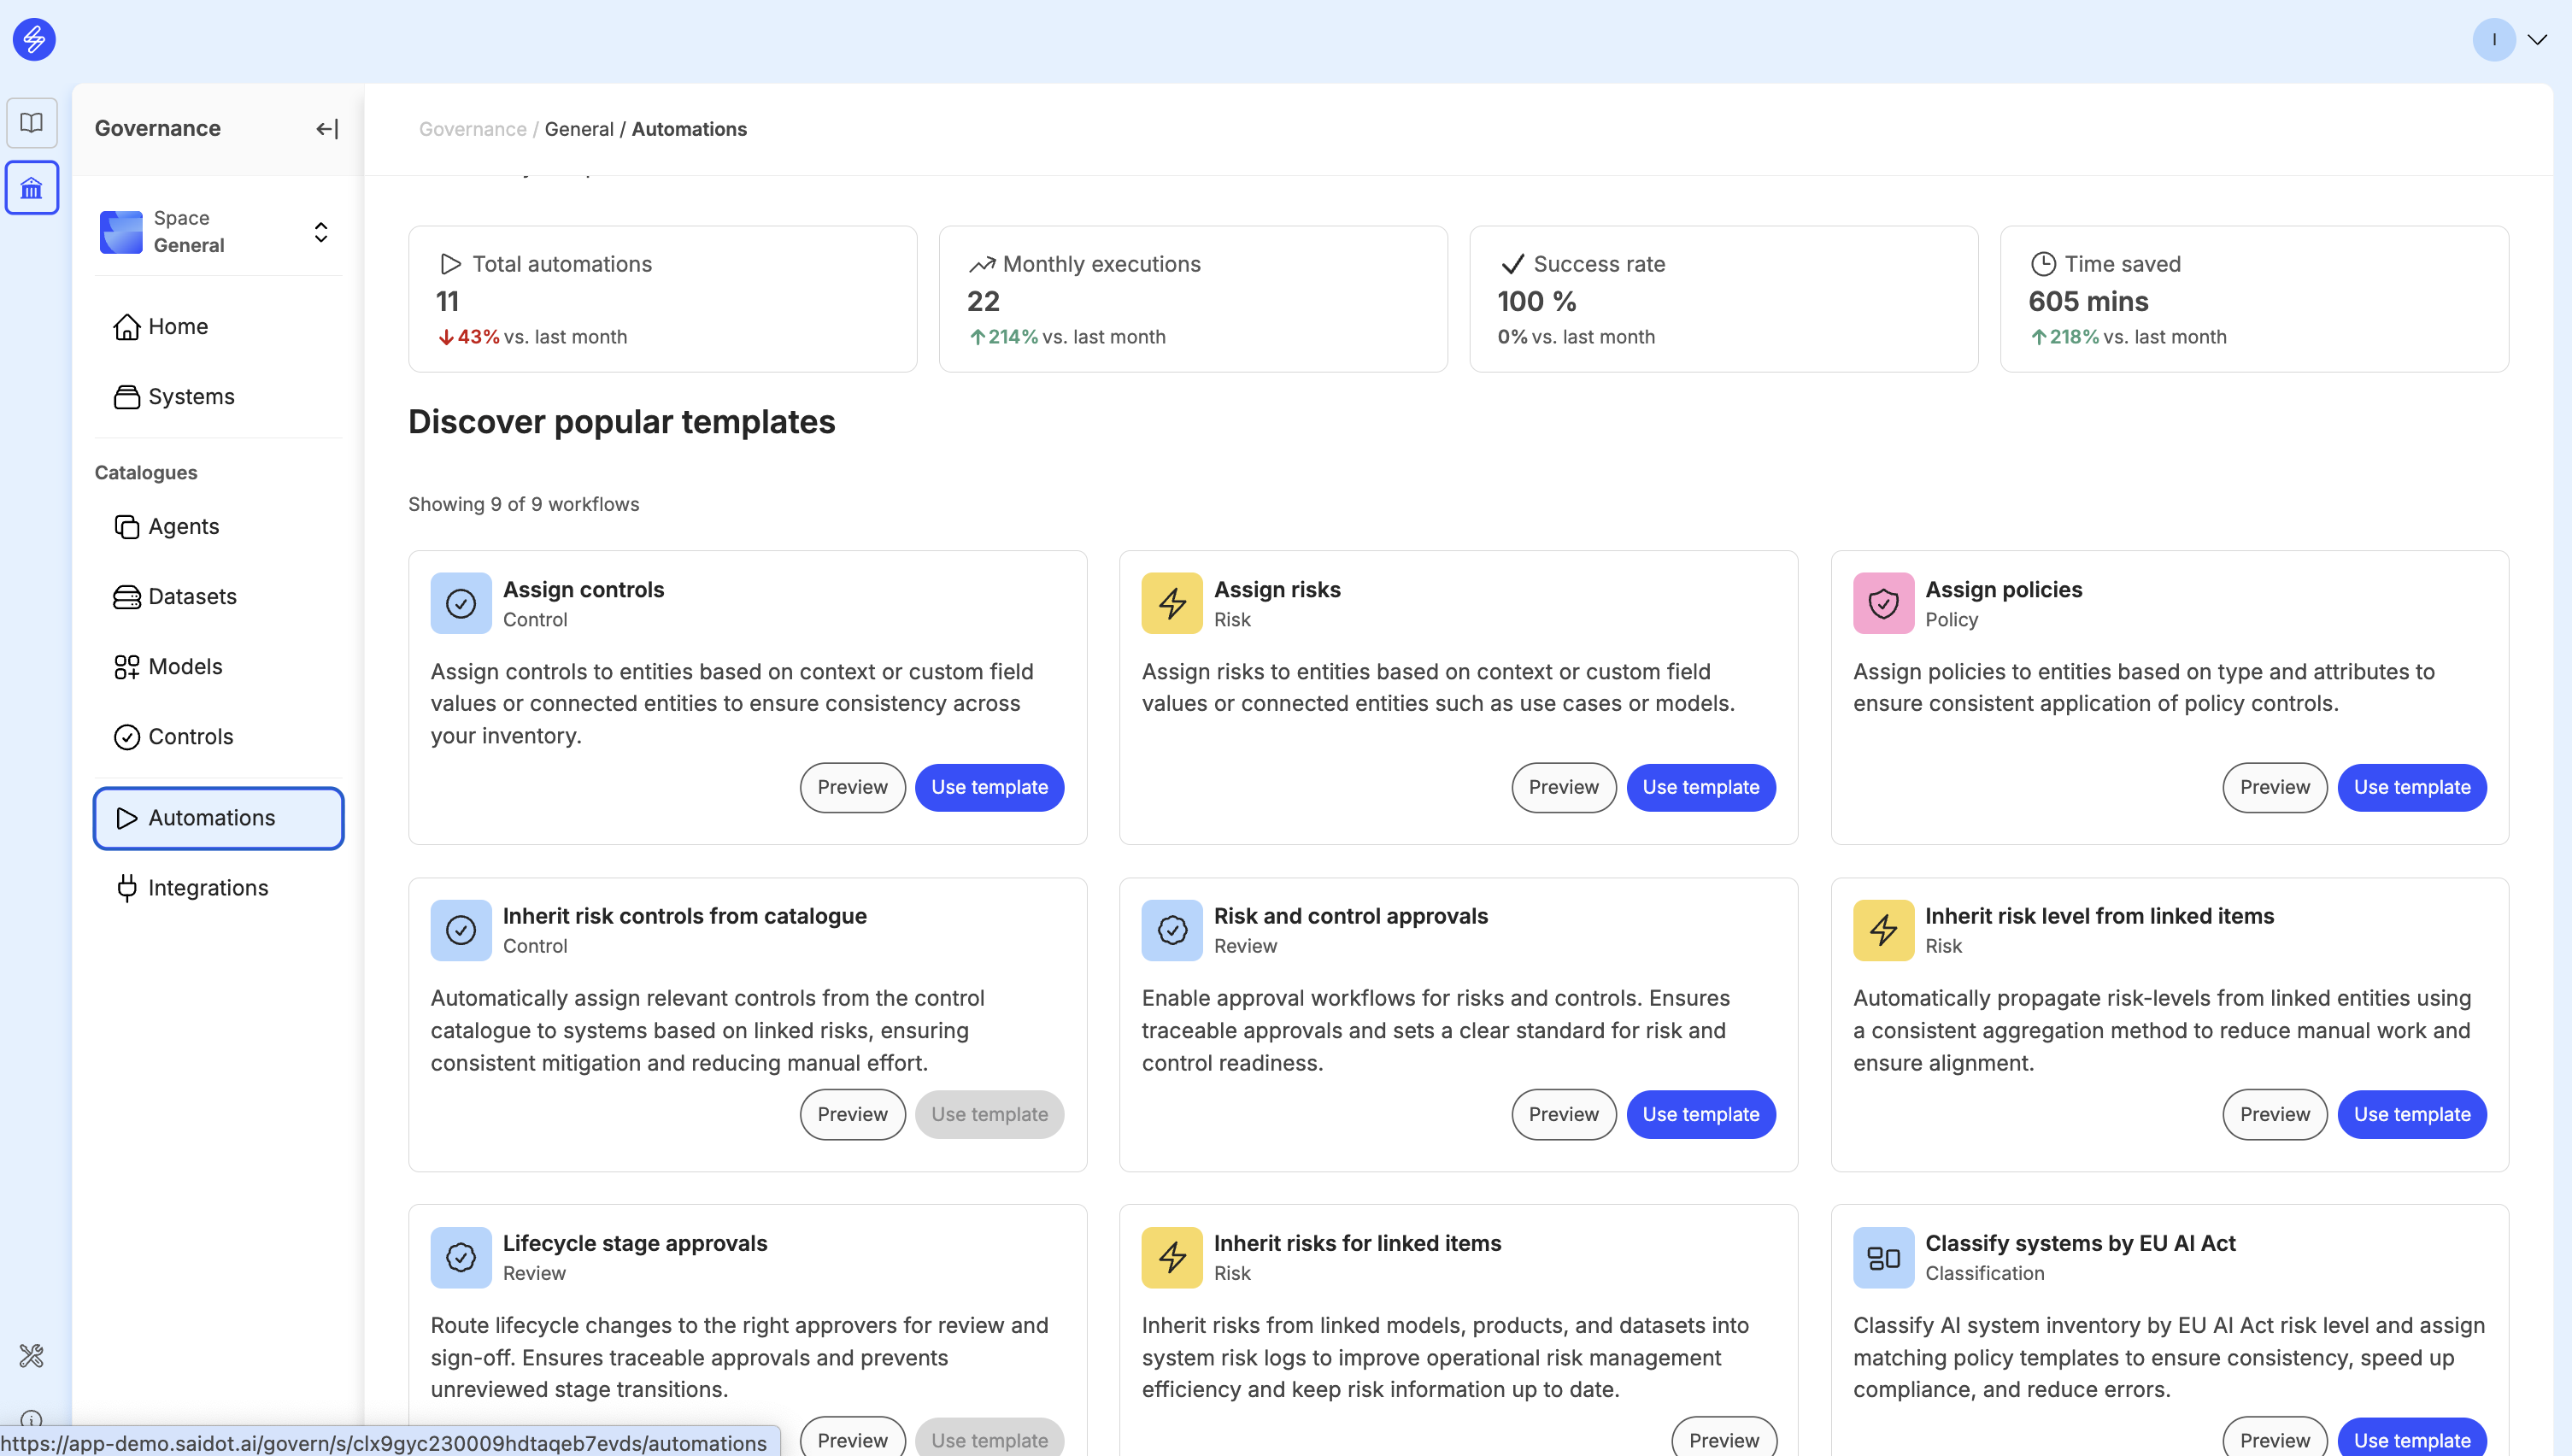
Metrics in Automations
Automations screen includes insights about
-
Activated automations
-
Monthly executions
-
Success rate
-
Time saved with automations
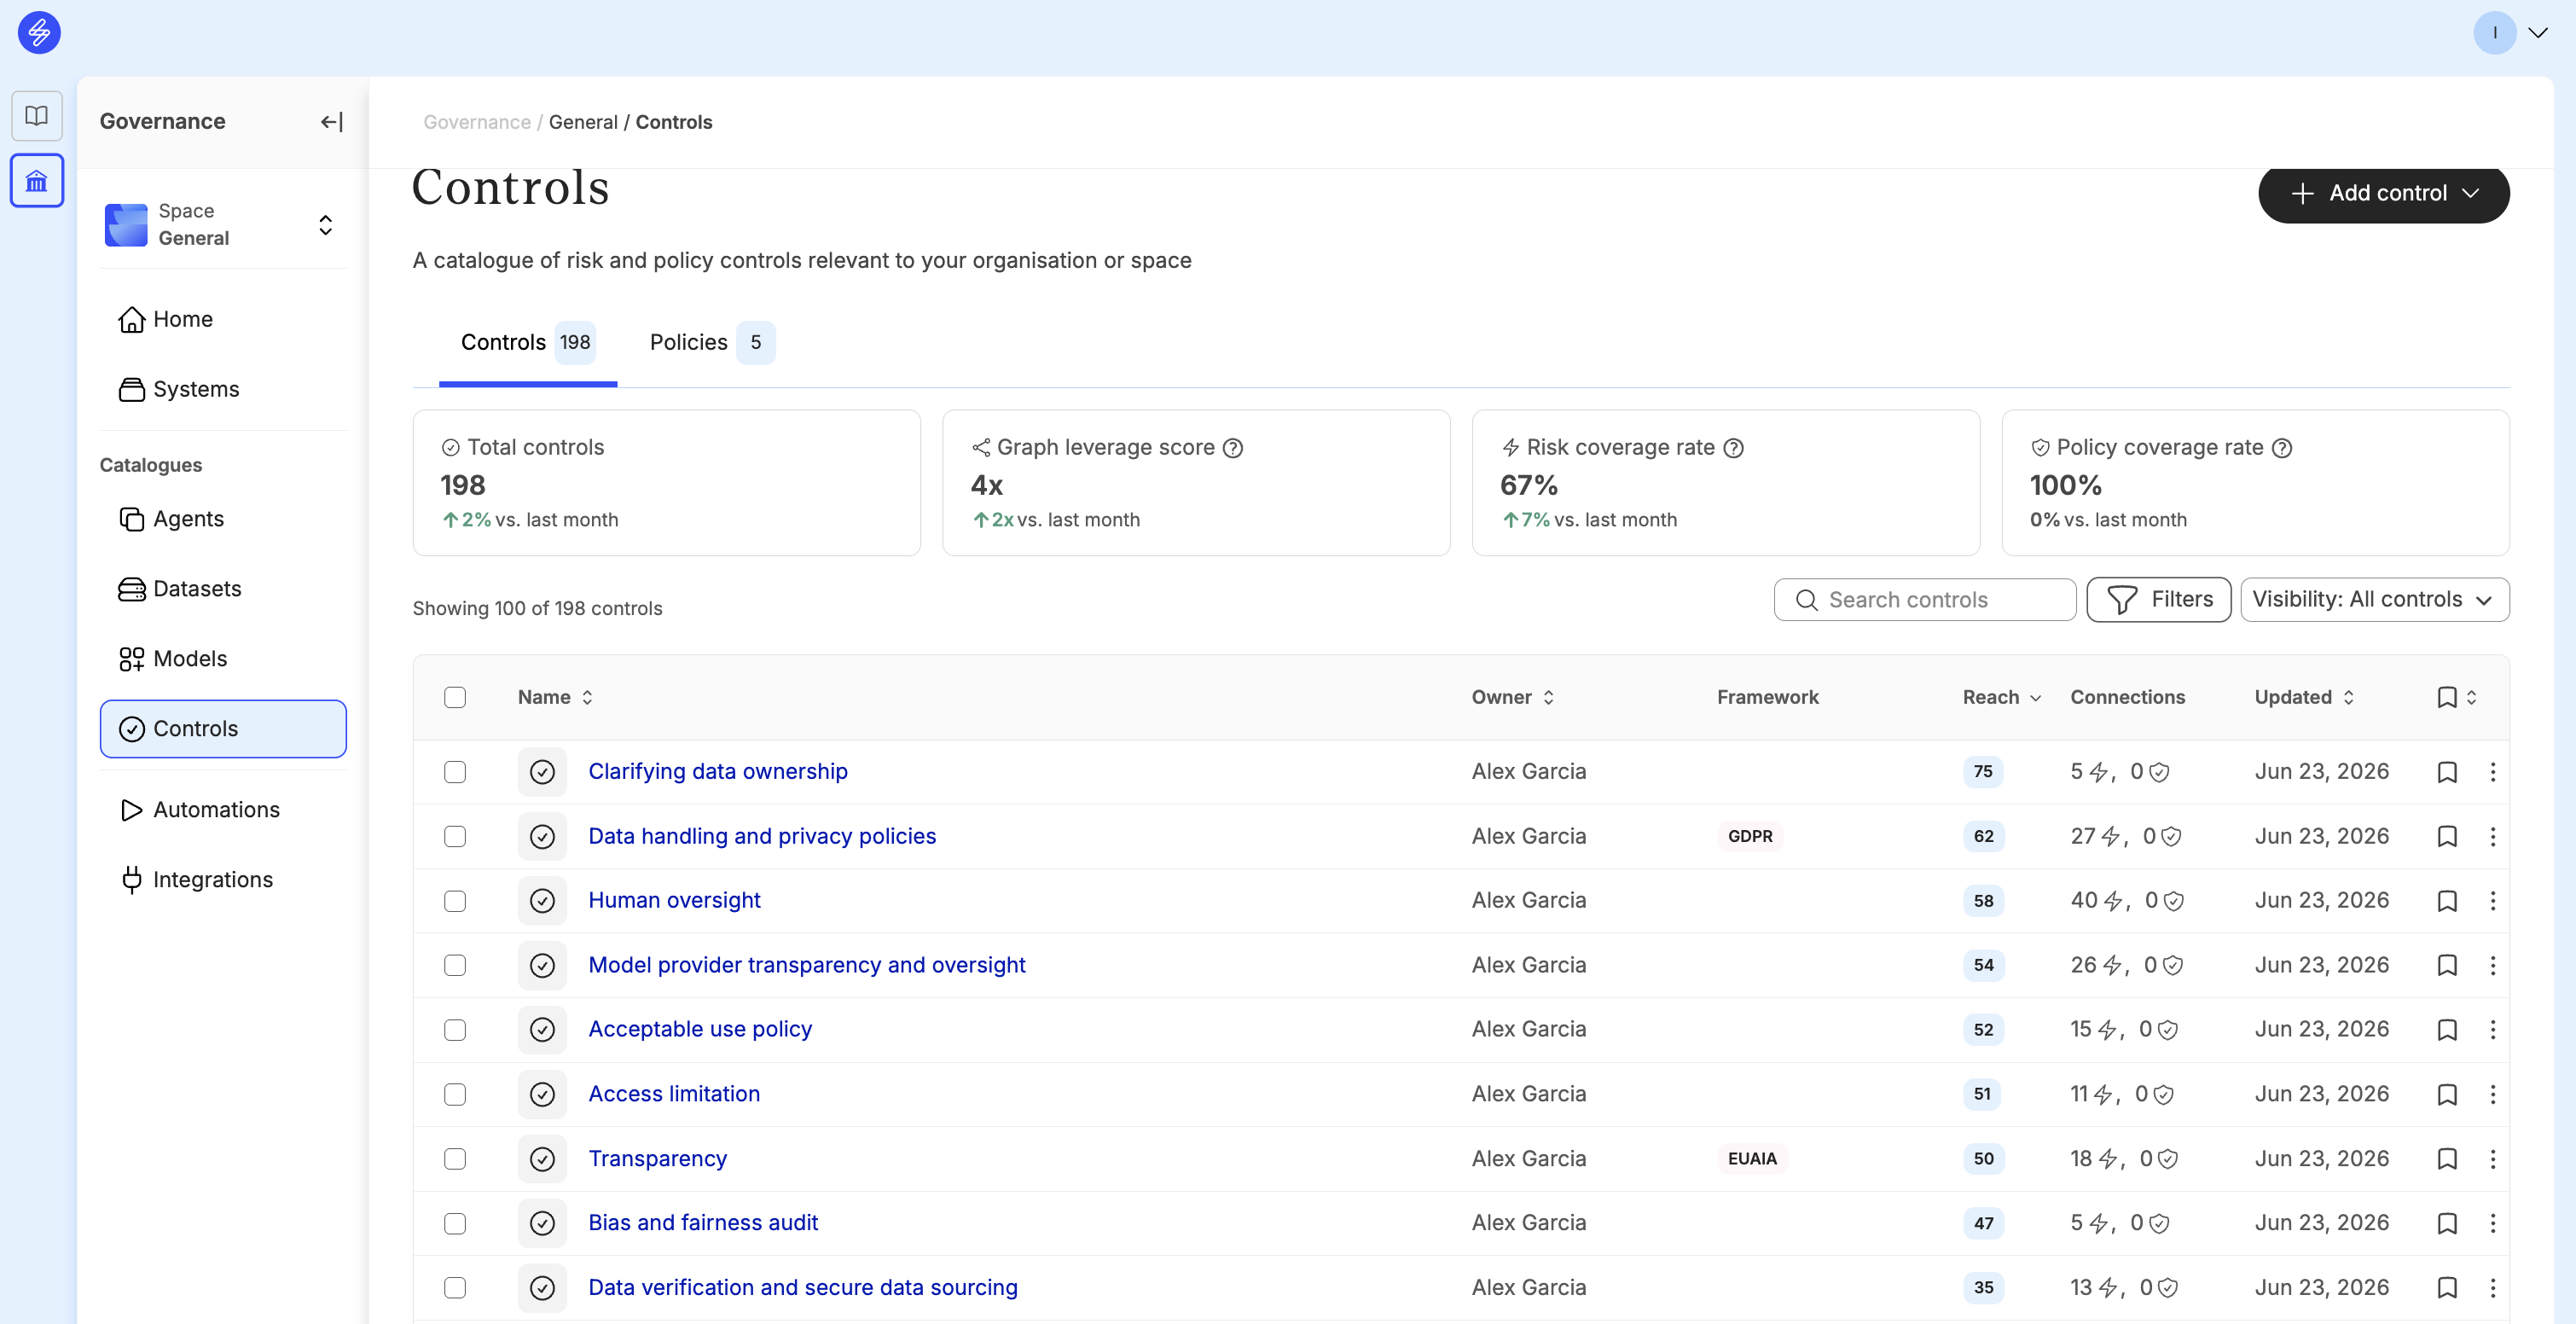
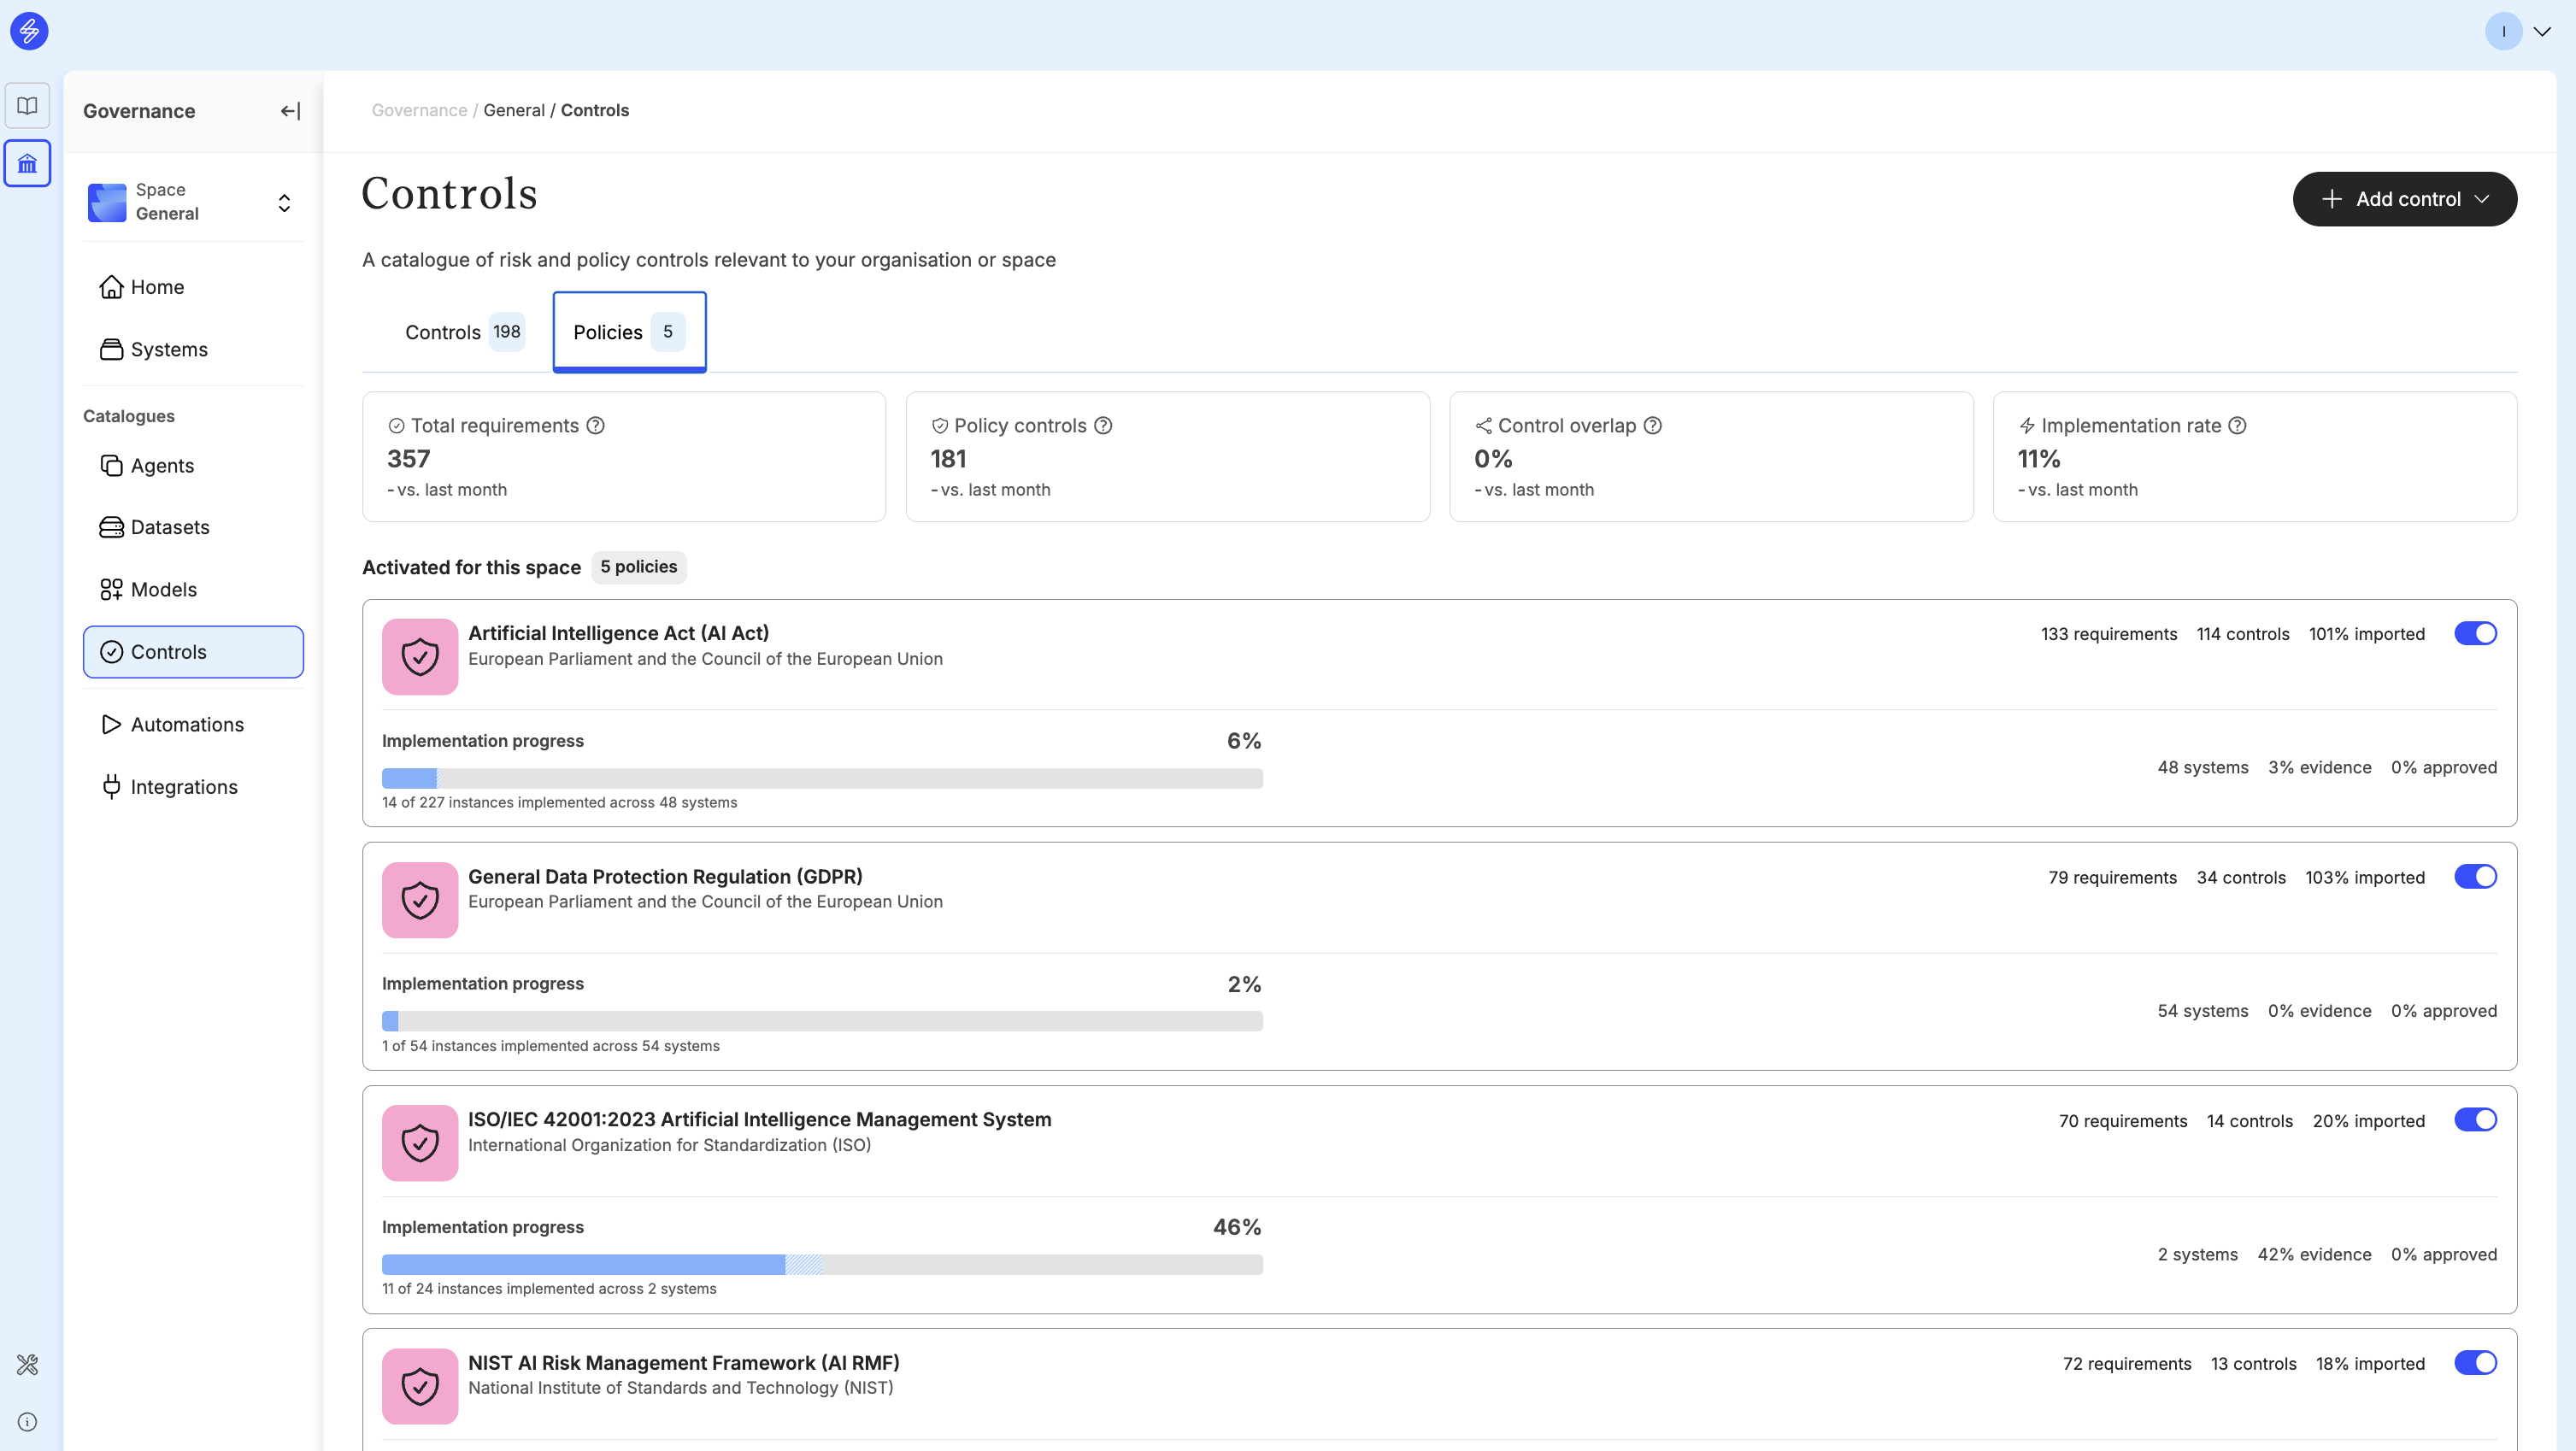
Metrics in Controls
Controls screen contains insights about
-
Total number of controls
-
Risk coverage rate - Share of risks in the system inventory that have at least one mapped catalogue control
-
Graph leverage score - Average number of system-level control instances each catalogue control generates through inheritance
-
Policy coverage rate - Share of policies in the system inventory that have at least one mapped catalogue control
Controls Policy screen contains information about
-
Total number of policy requirements from activated policies
-
Total number of controls from activated policies
-
Control overlap - Share of controls that are linked to requirements from two or more policies.
-
Implementation rate - Share of catalogue controls implemented in at least one system.
Metrics in Systems inventory
Systems screen contains metrics about
-
Total number of systems in the inventory
-
System classification rate - Share of systems with a risk level assigned.
-
Control readiness rate - Share of controls with status "Implemented" or "Complete" across all systems.
-
Systems with pending reviews - Total number of pending reviews in this systems inventory.
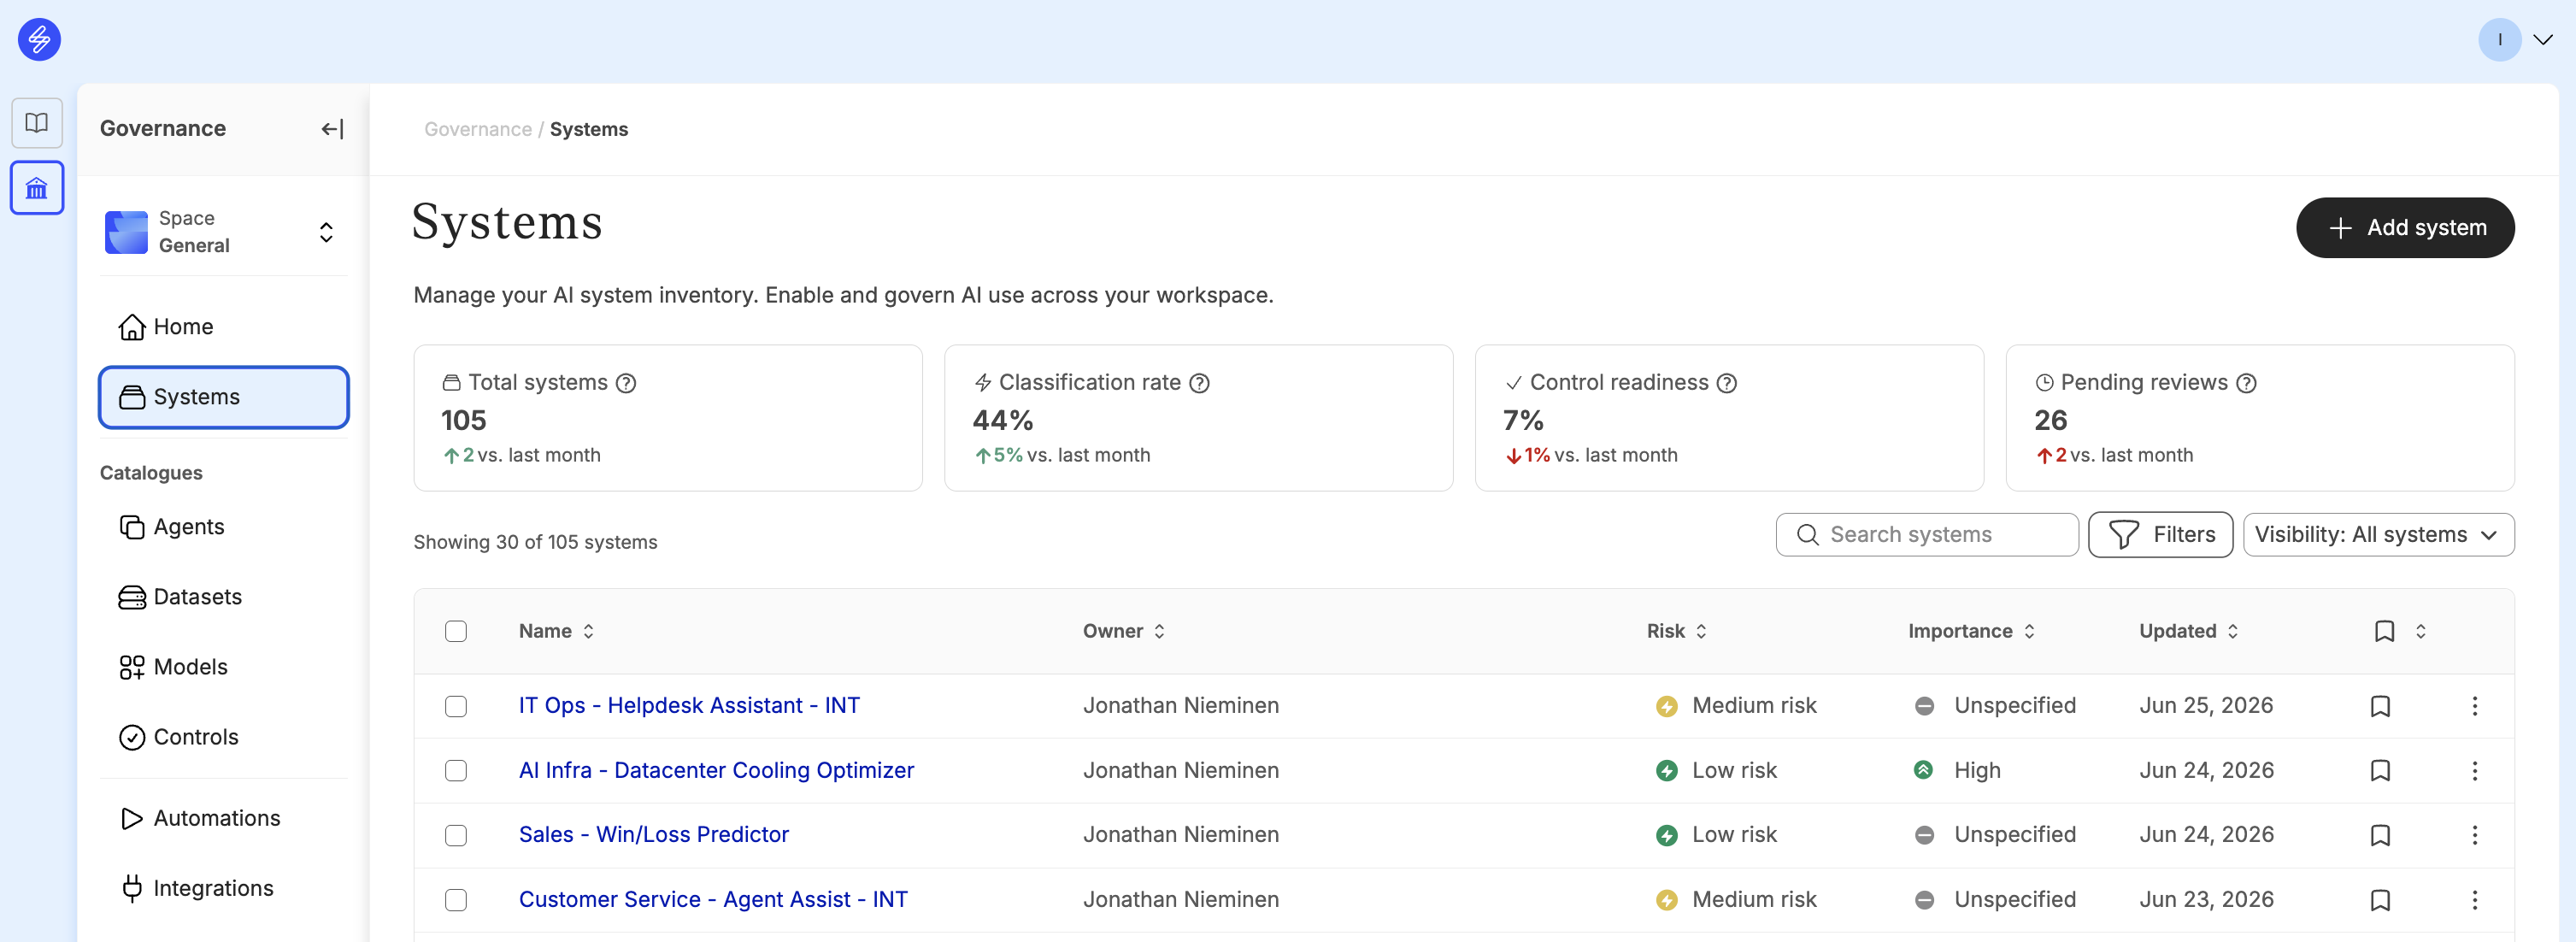
Systems view also provides possibility to filter and analyse the inventory based on
-
System owner, context and lifecycle phase
-
System components and any other linked data
-
Risk and policy management items
-
Number of linked risks, policies, Evaluations and Reviews
Metrics to analyse system level governance progress
AI system owners, reviewers and governance managers can also analyse system level governance progress using the metrics in each system level tab.
System level risk management progress
Risk tab contains insights about
-
Total number of risks
-
Risk inheritance rate - Share of this system's risks that have been inherited from components such as products, models, datasets or agents
-
Treatment coverage - Share of this system's risks that have a treatment strategy set (avoid or accept) and at least one control implemented/completed (mitigate).
-
Acceptable rate - Share of this system's risks where residual risk is within the acceptable level.
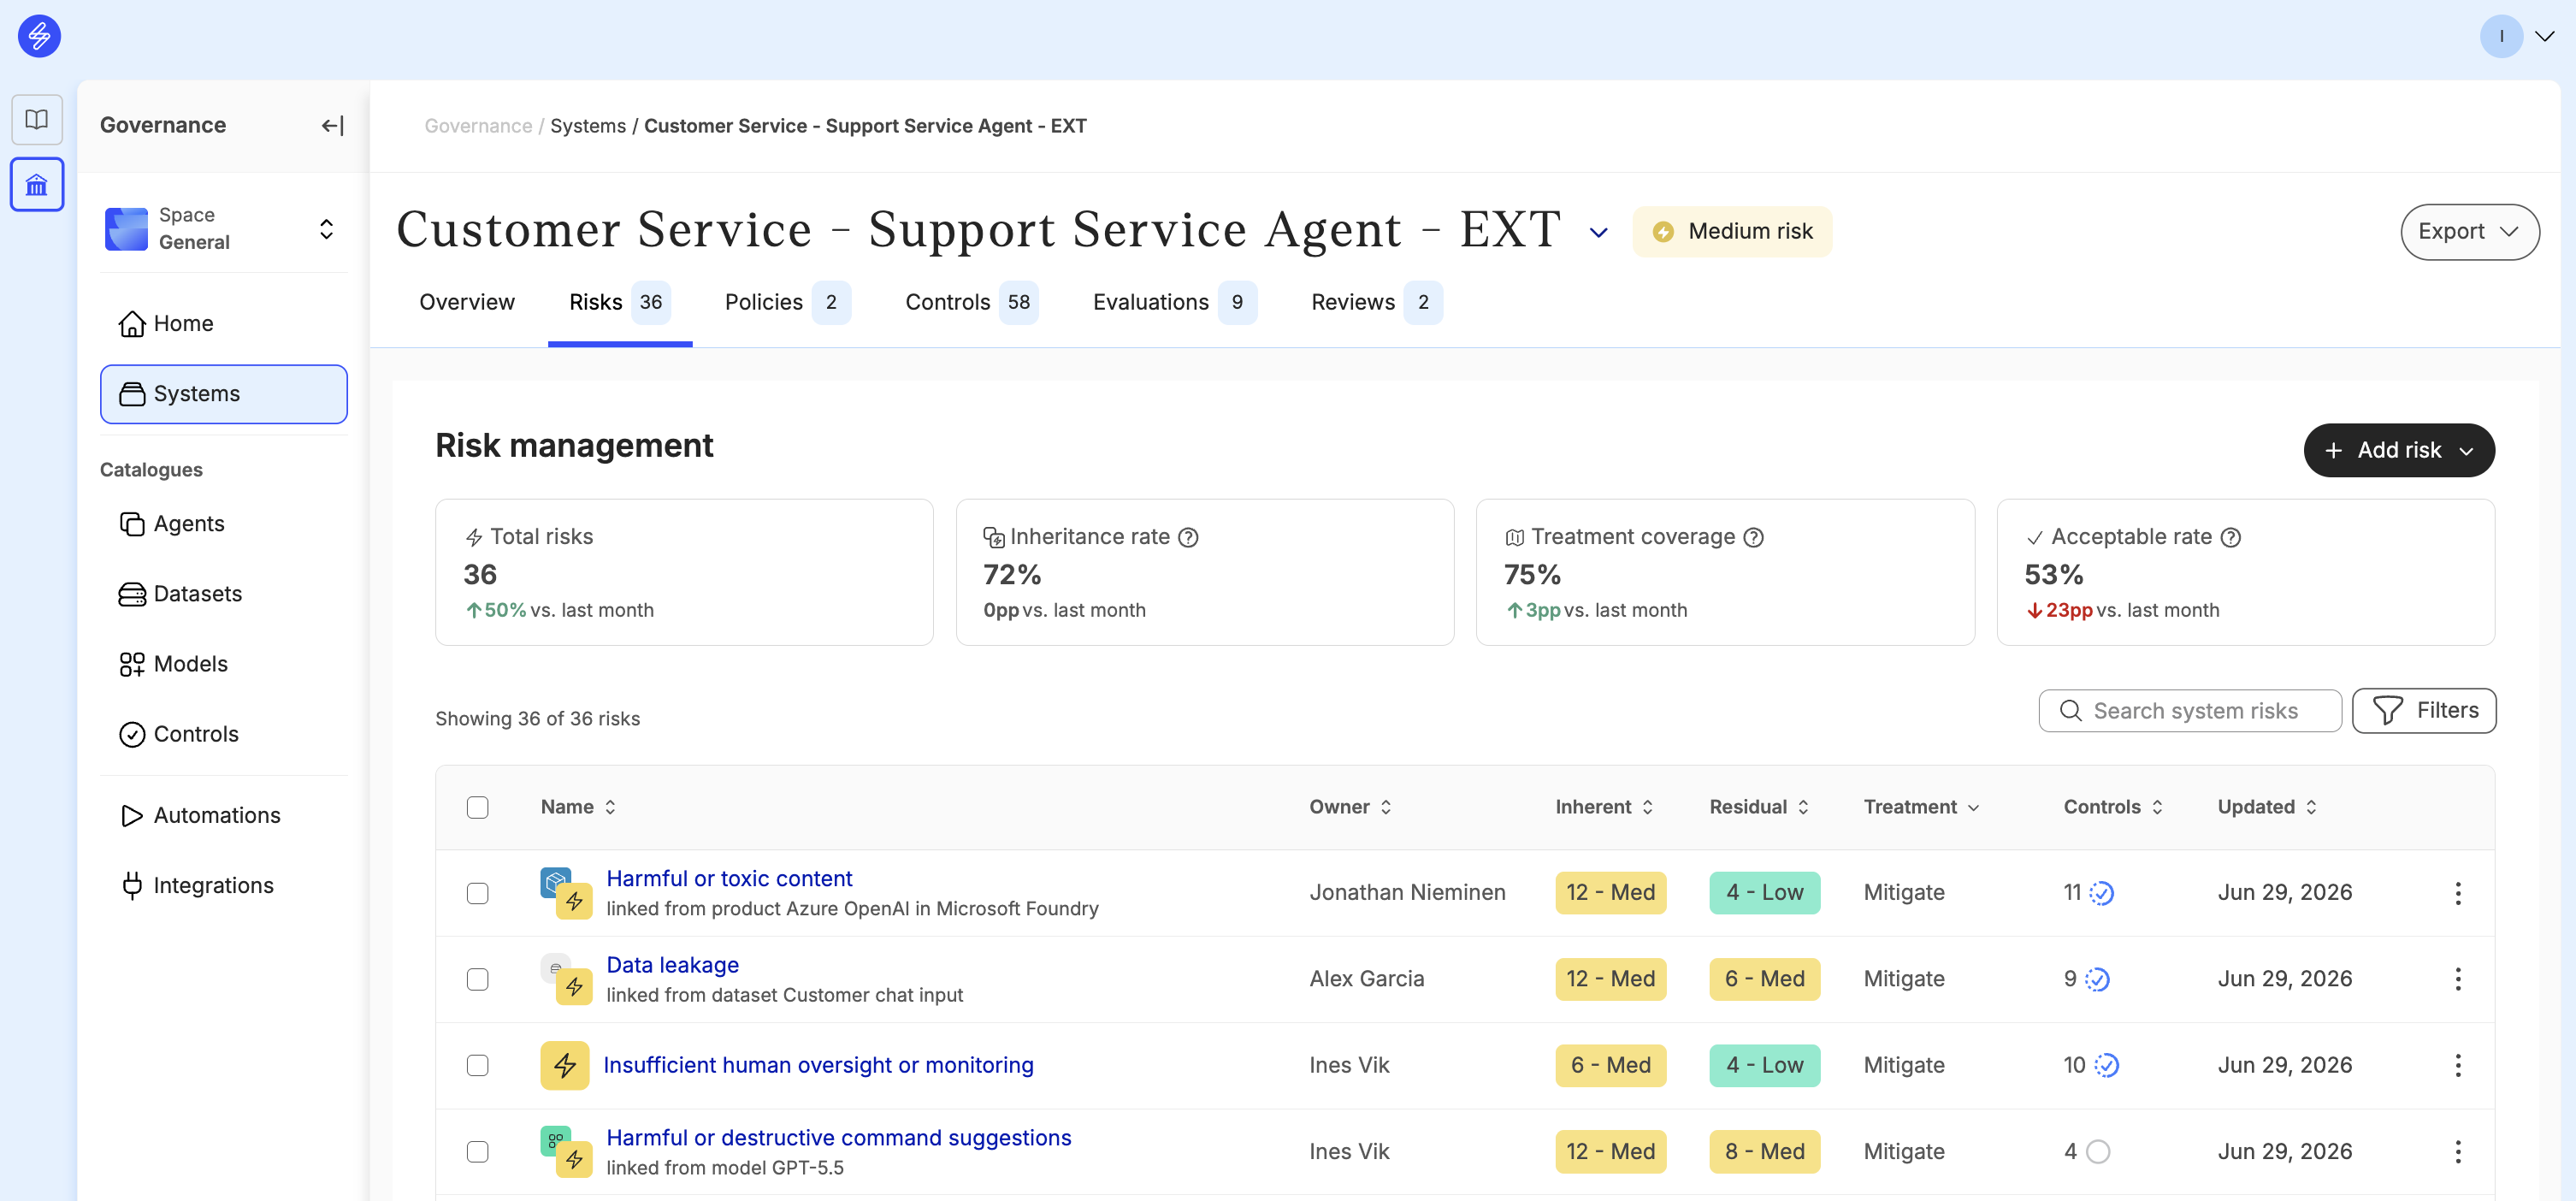
Risk analysis can also be filtered according to owner, source, type, treatment strategy, risk level or linked products, models or datasets.
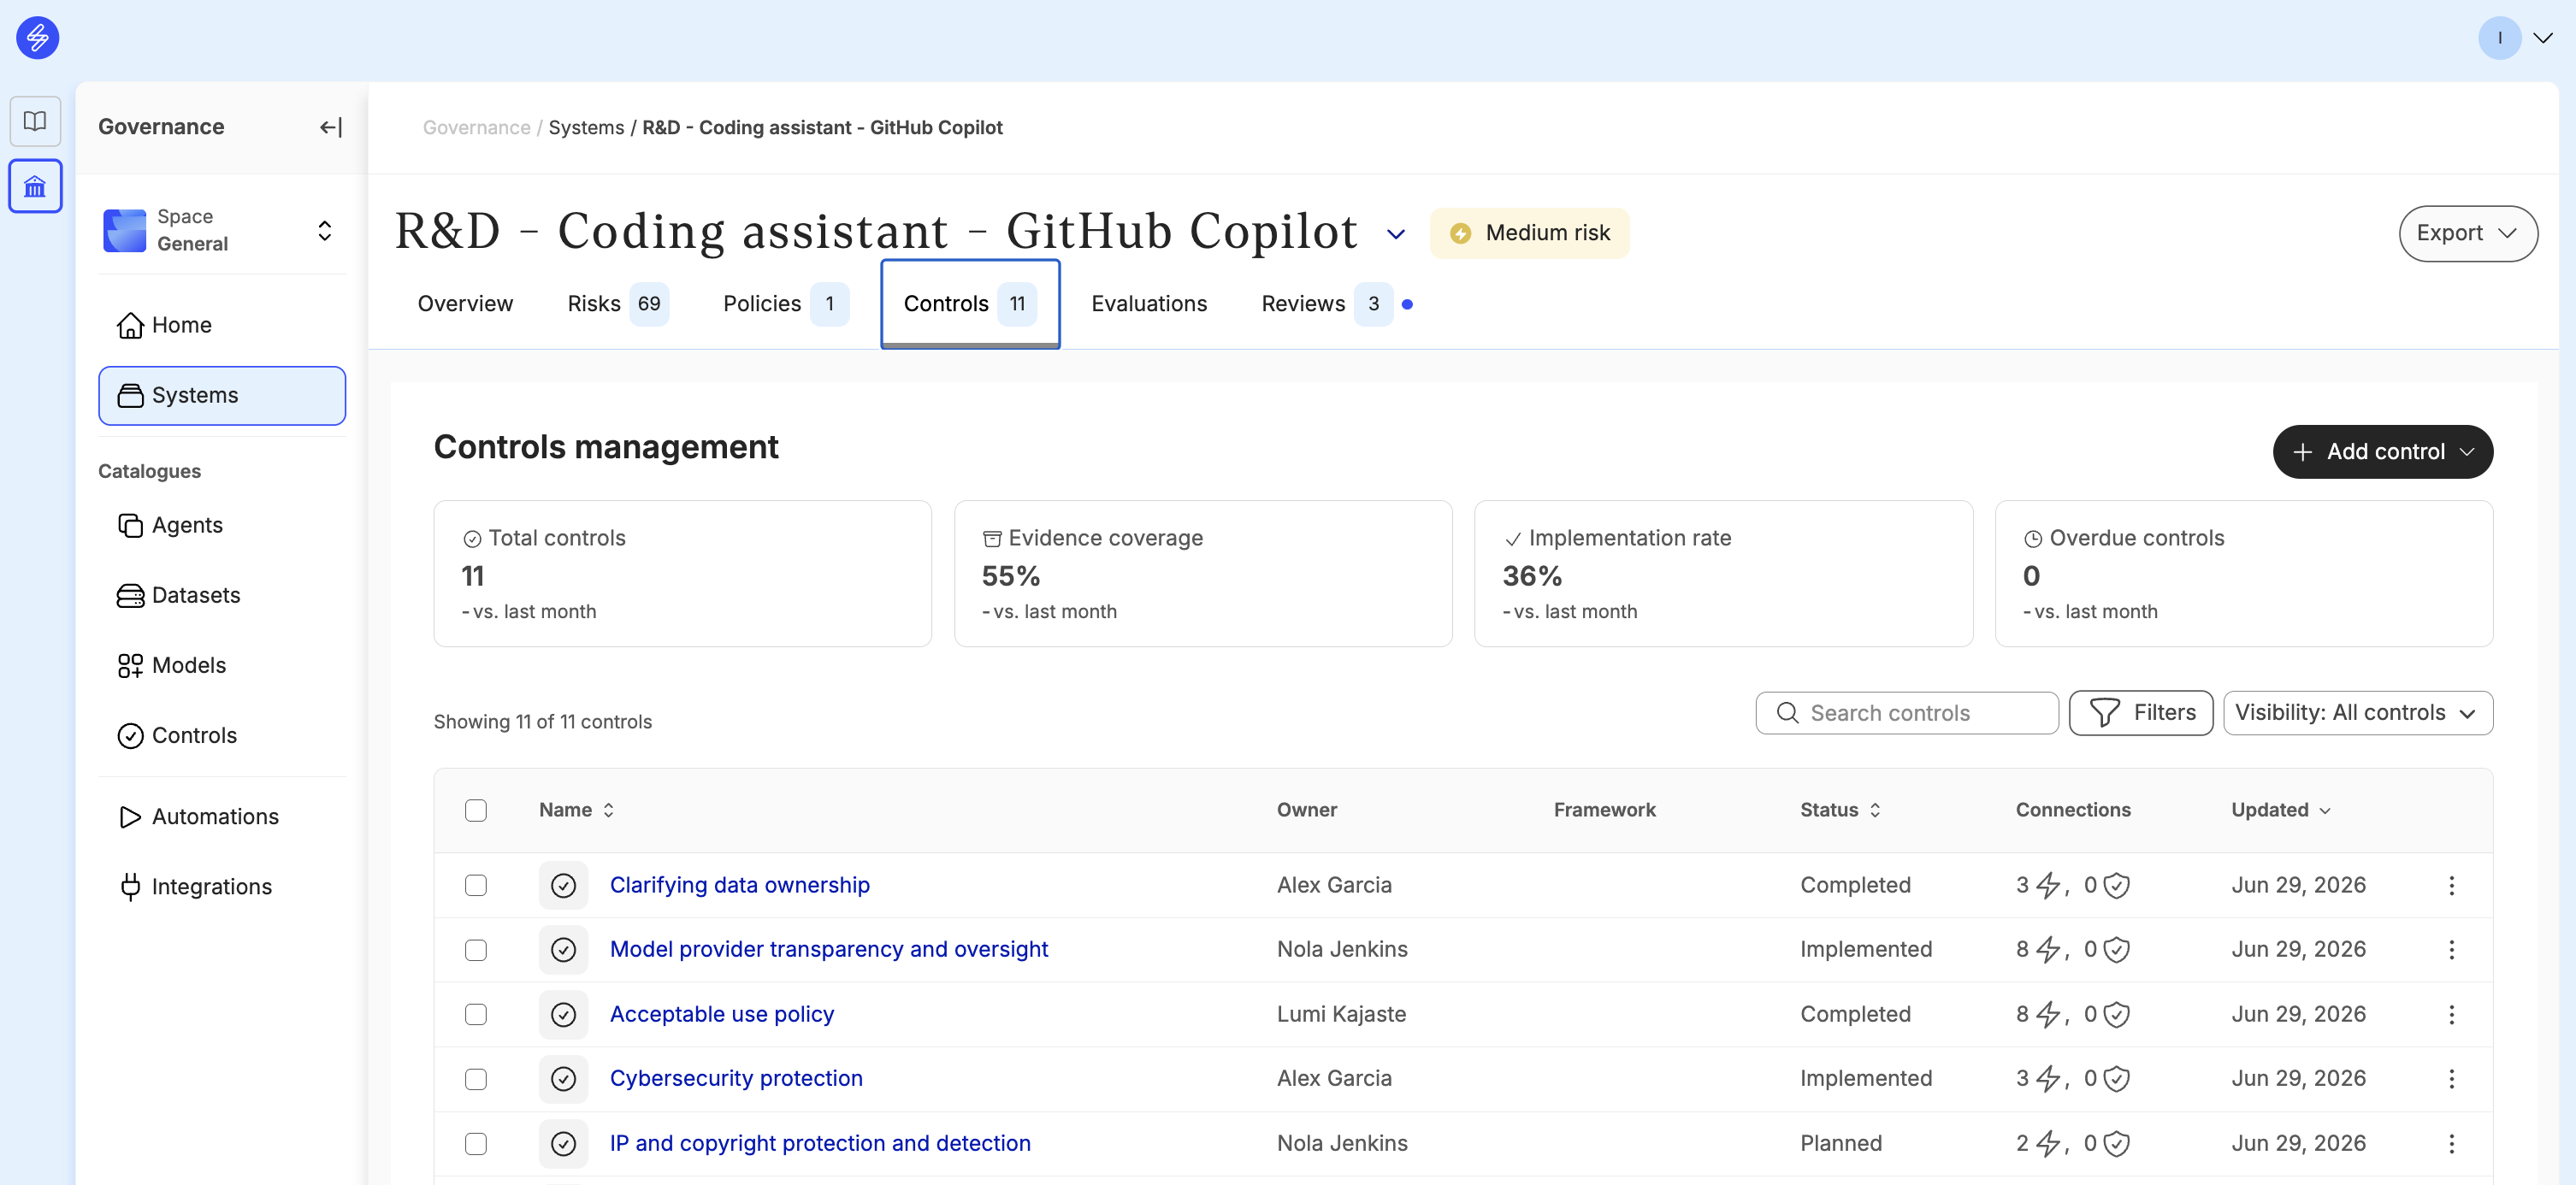
Control progress
Controls tab contains insights about
-
Total number of controls in the system
-
Control treatment coverage
-
Implementation rate
-
Number of overdue controls
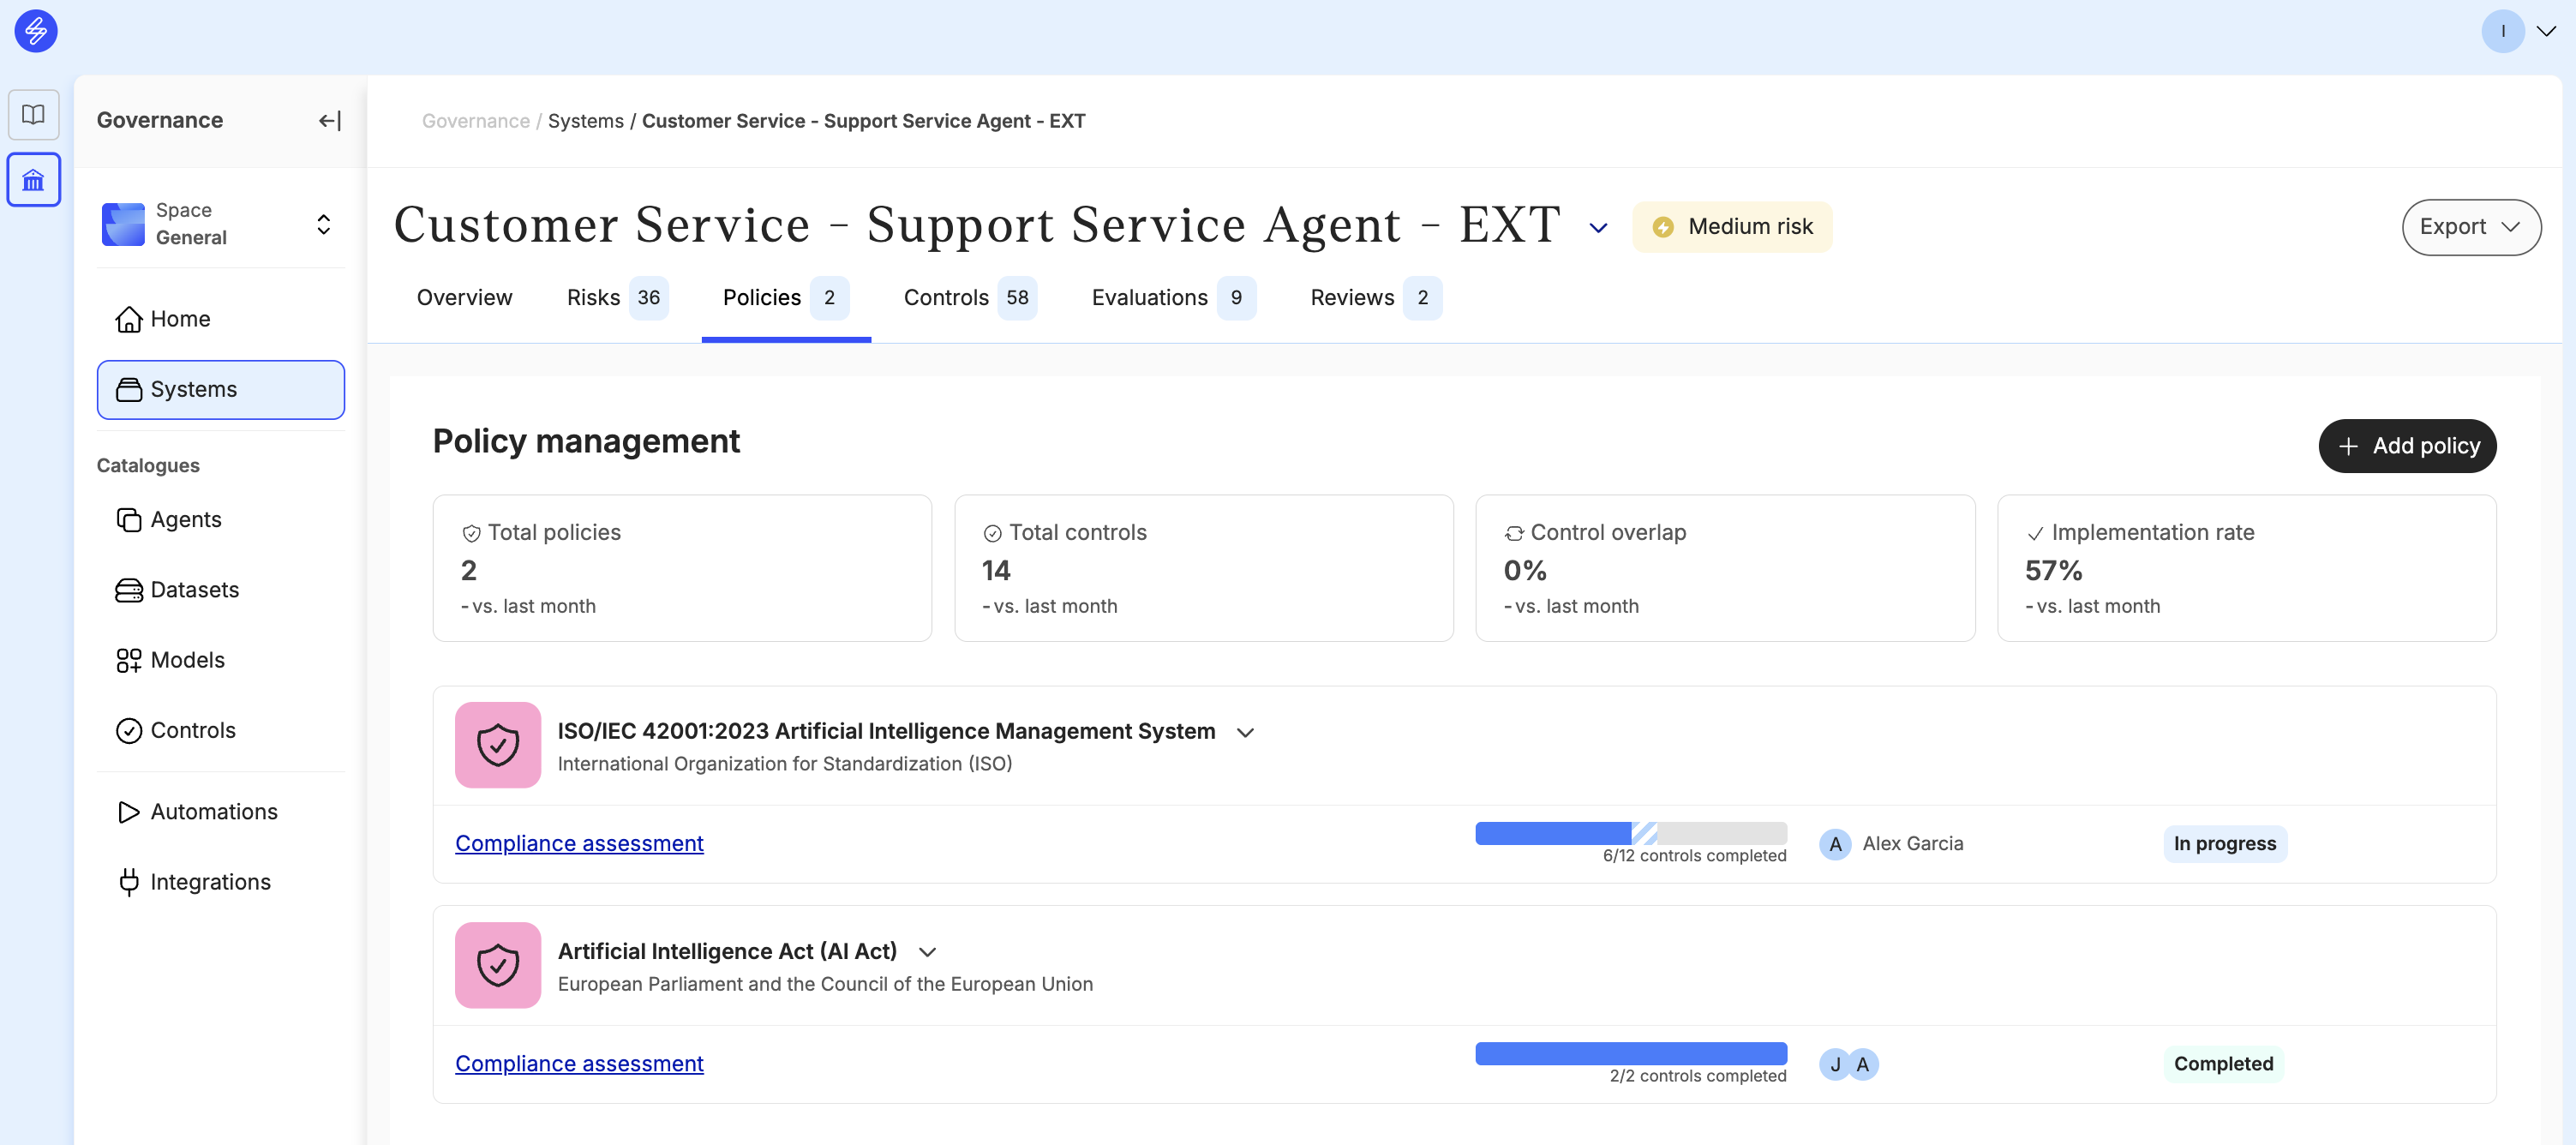
Compliance assessment progress
Policy tab contains insights about
-
Applicable policies
-
Total number of controls
-
Control overlap rate
-
Control implementation rate
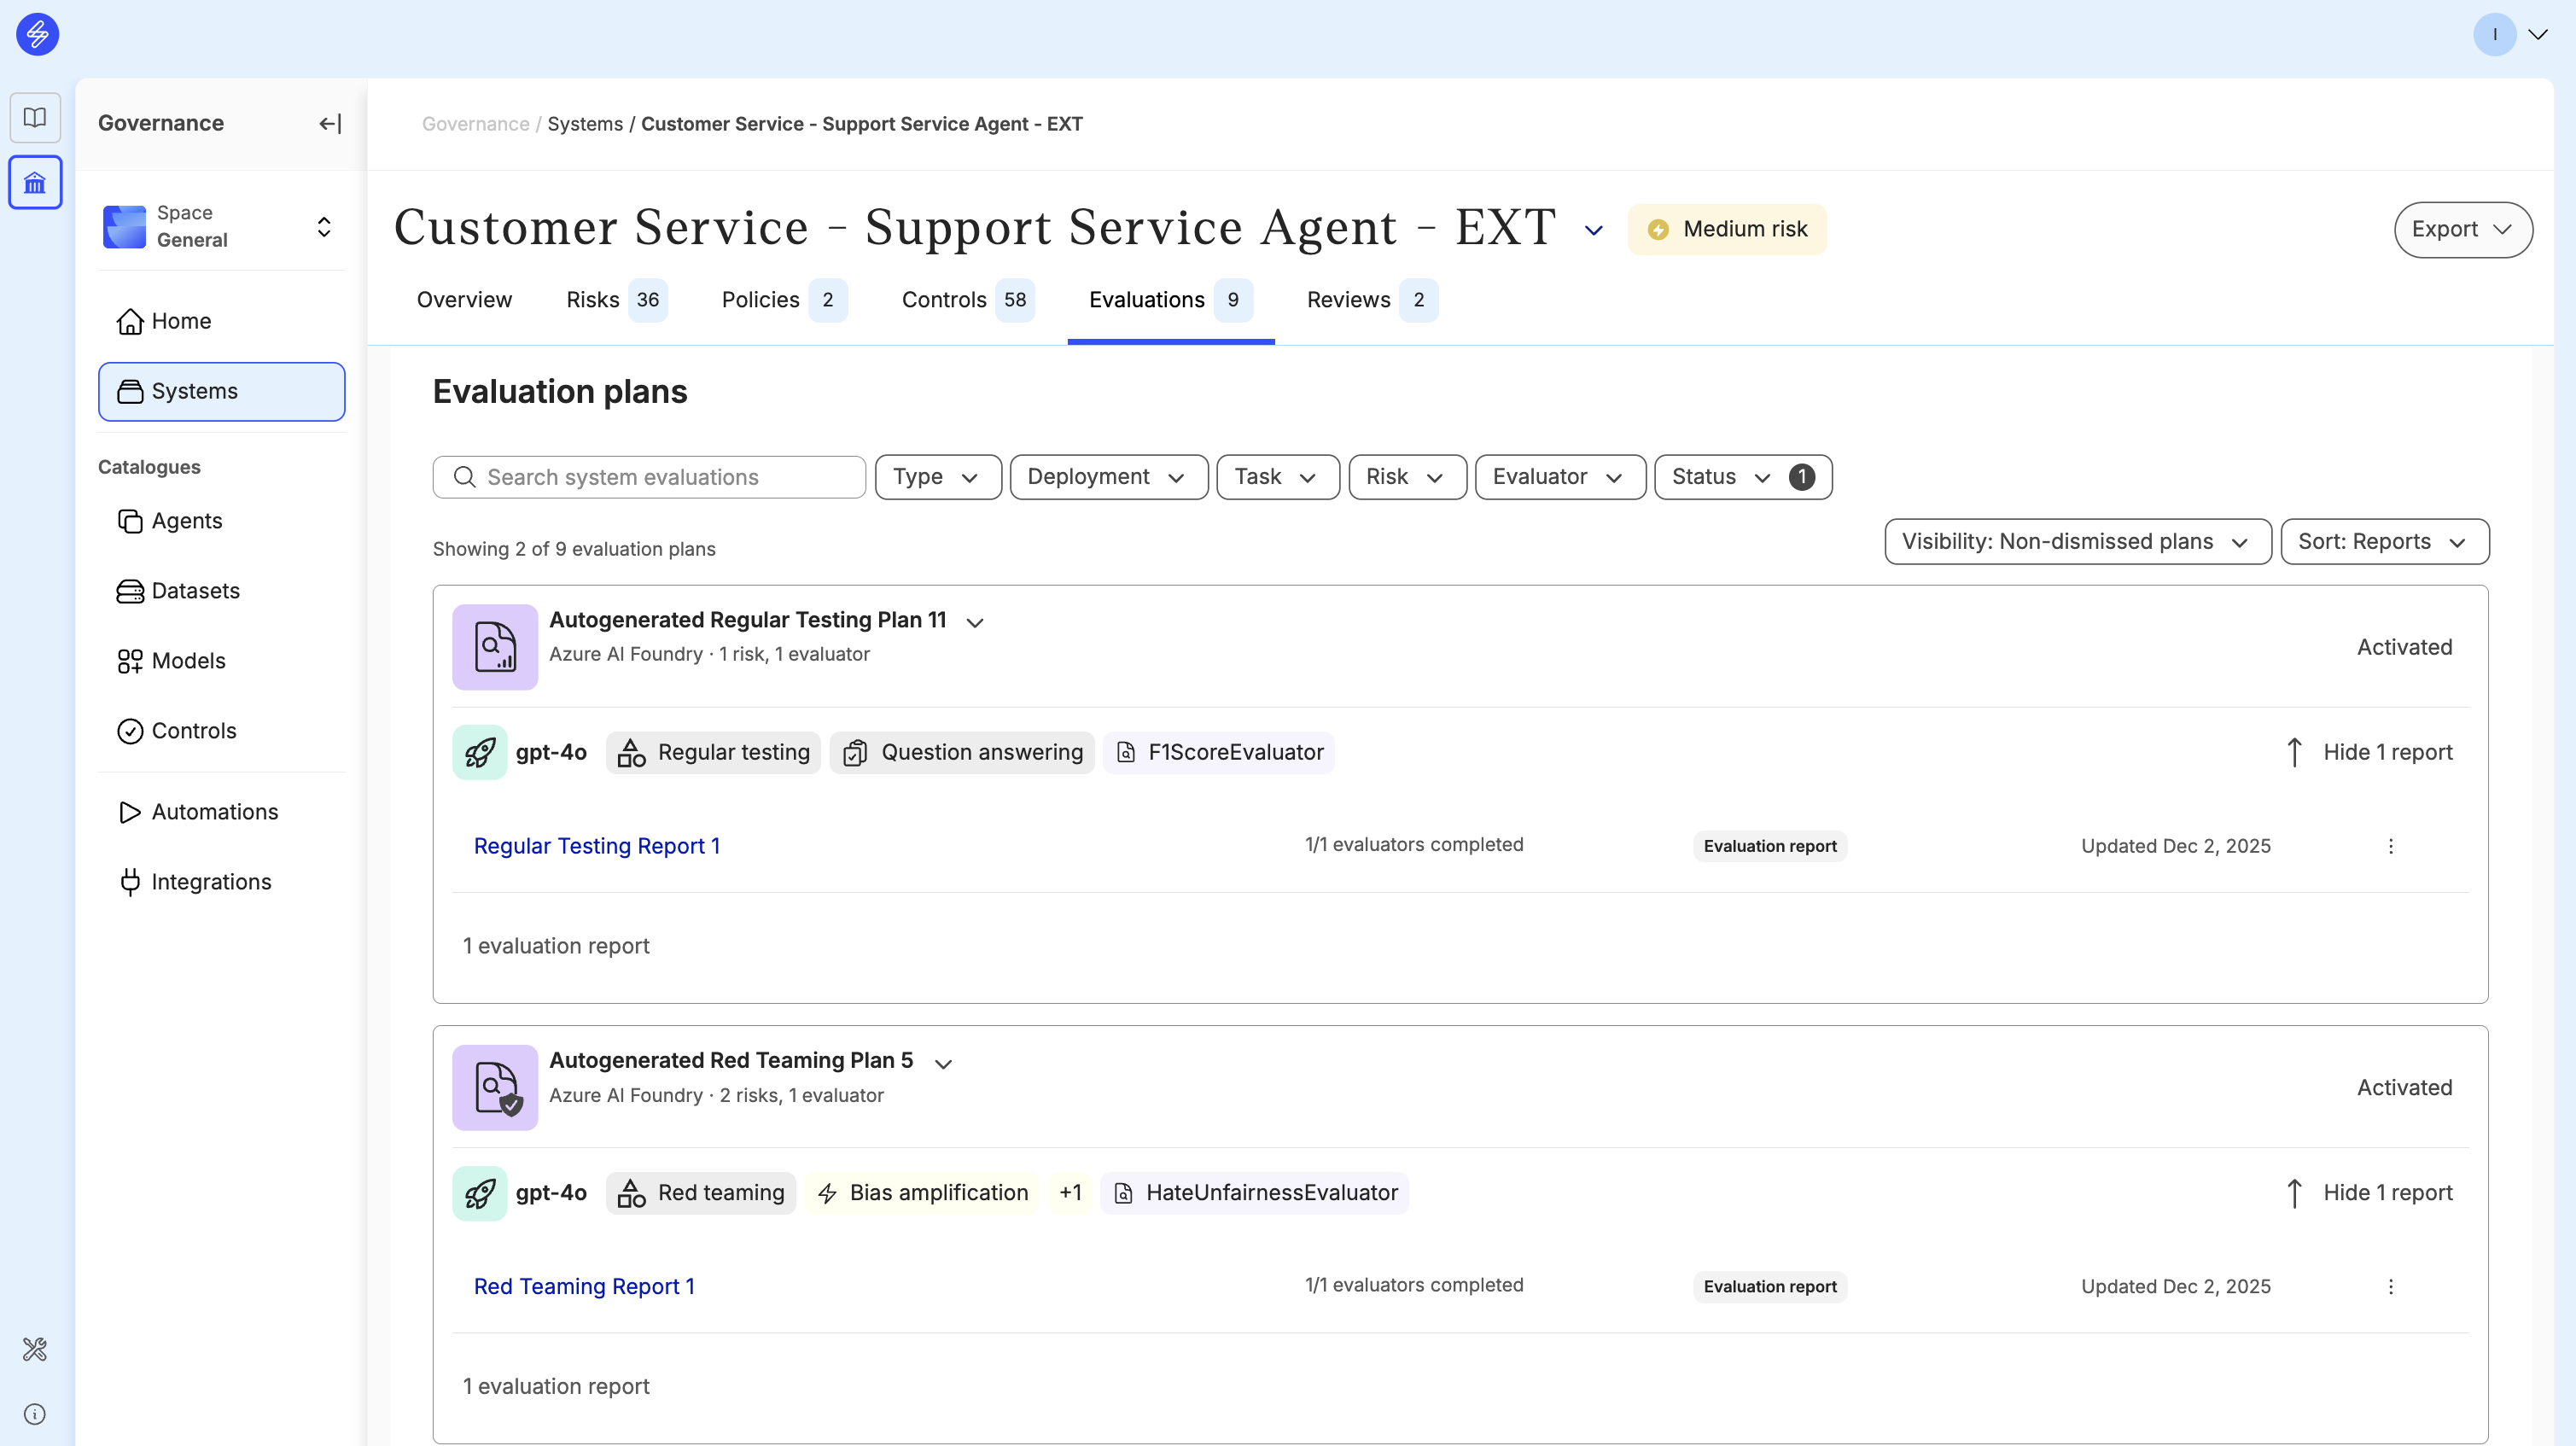
Evaluations progress
Evaluations tab contains insights about
-
Automatically generated evaluation plans
-
Activated and run evaluations
-
Evaluation reports with possibility to compare several evaluations
Review progress
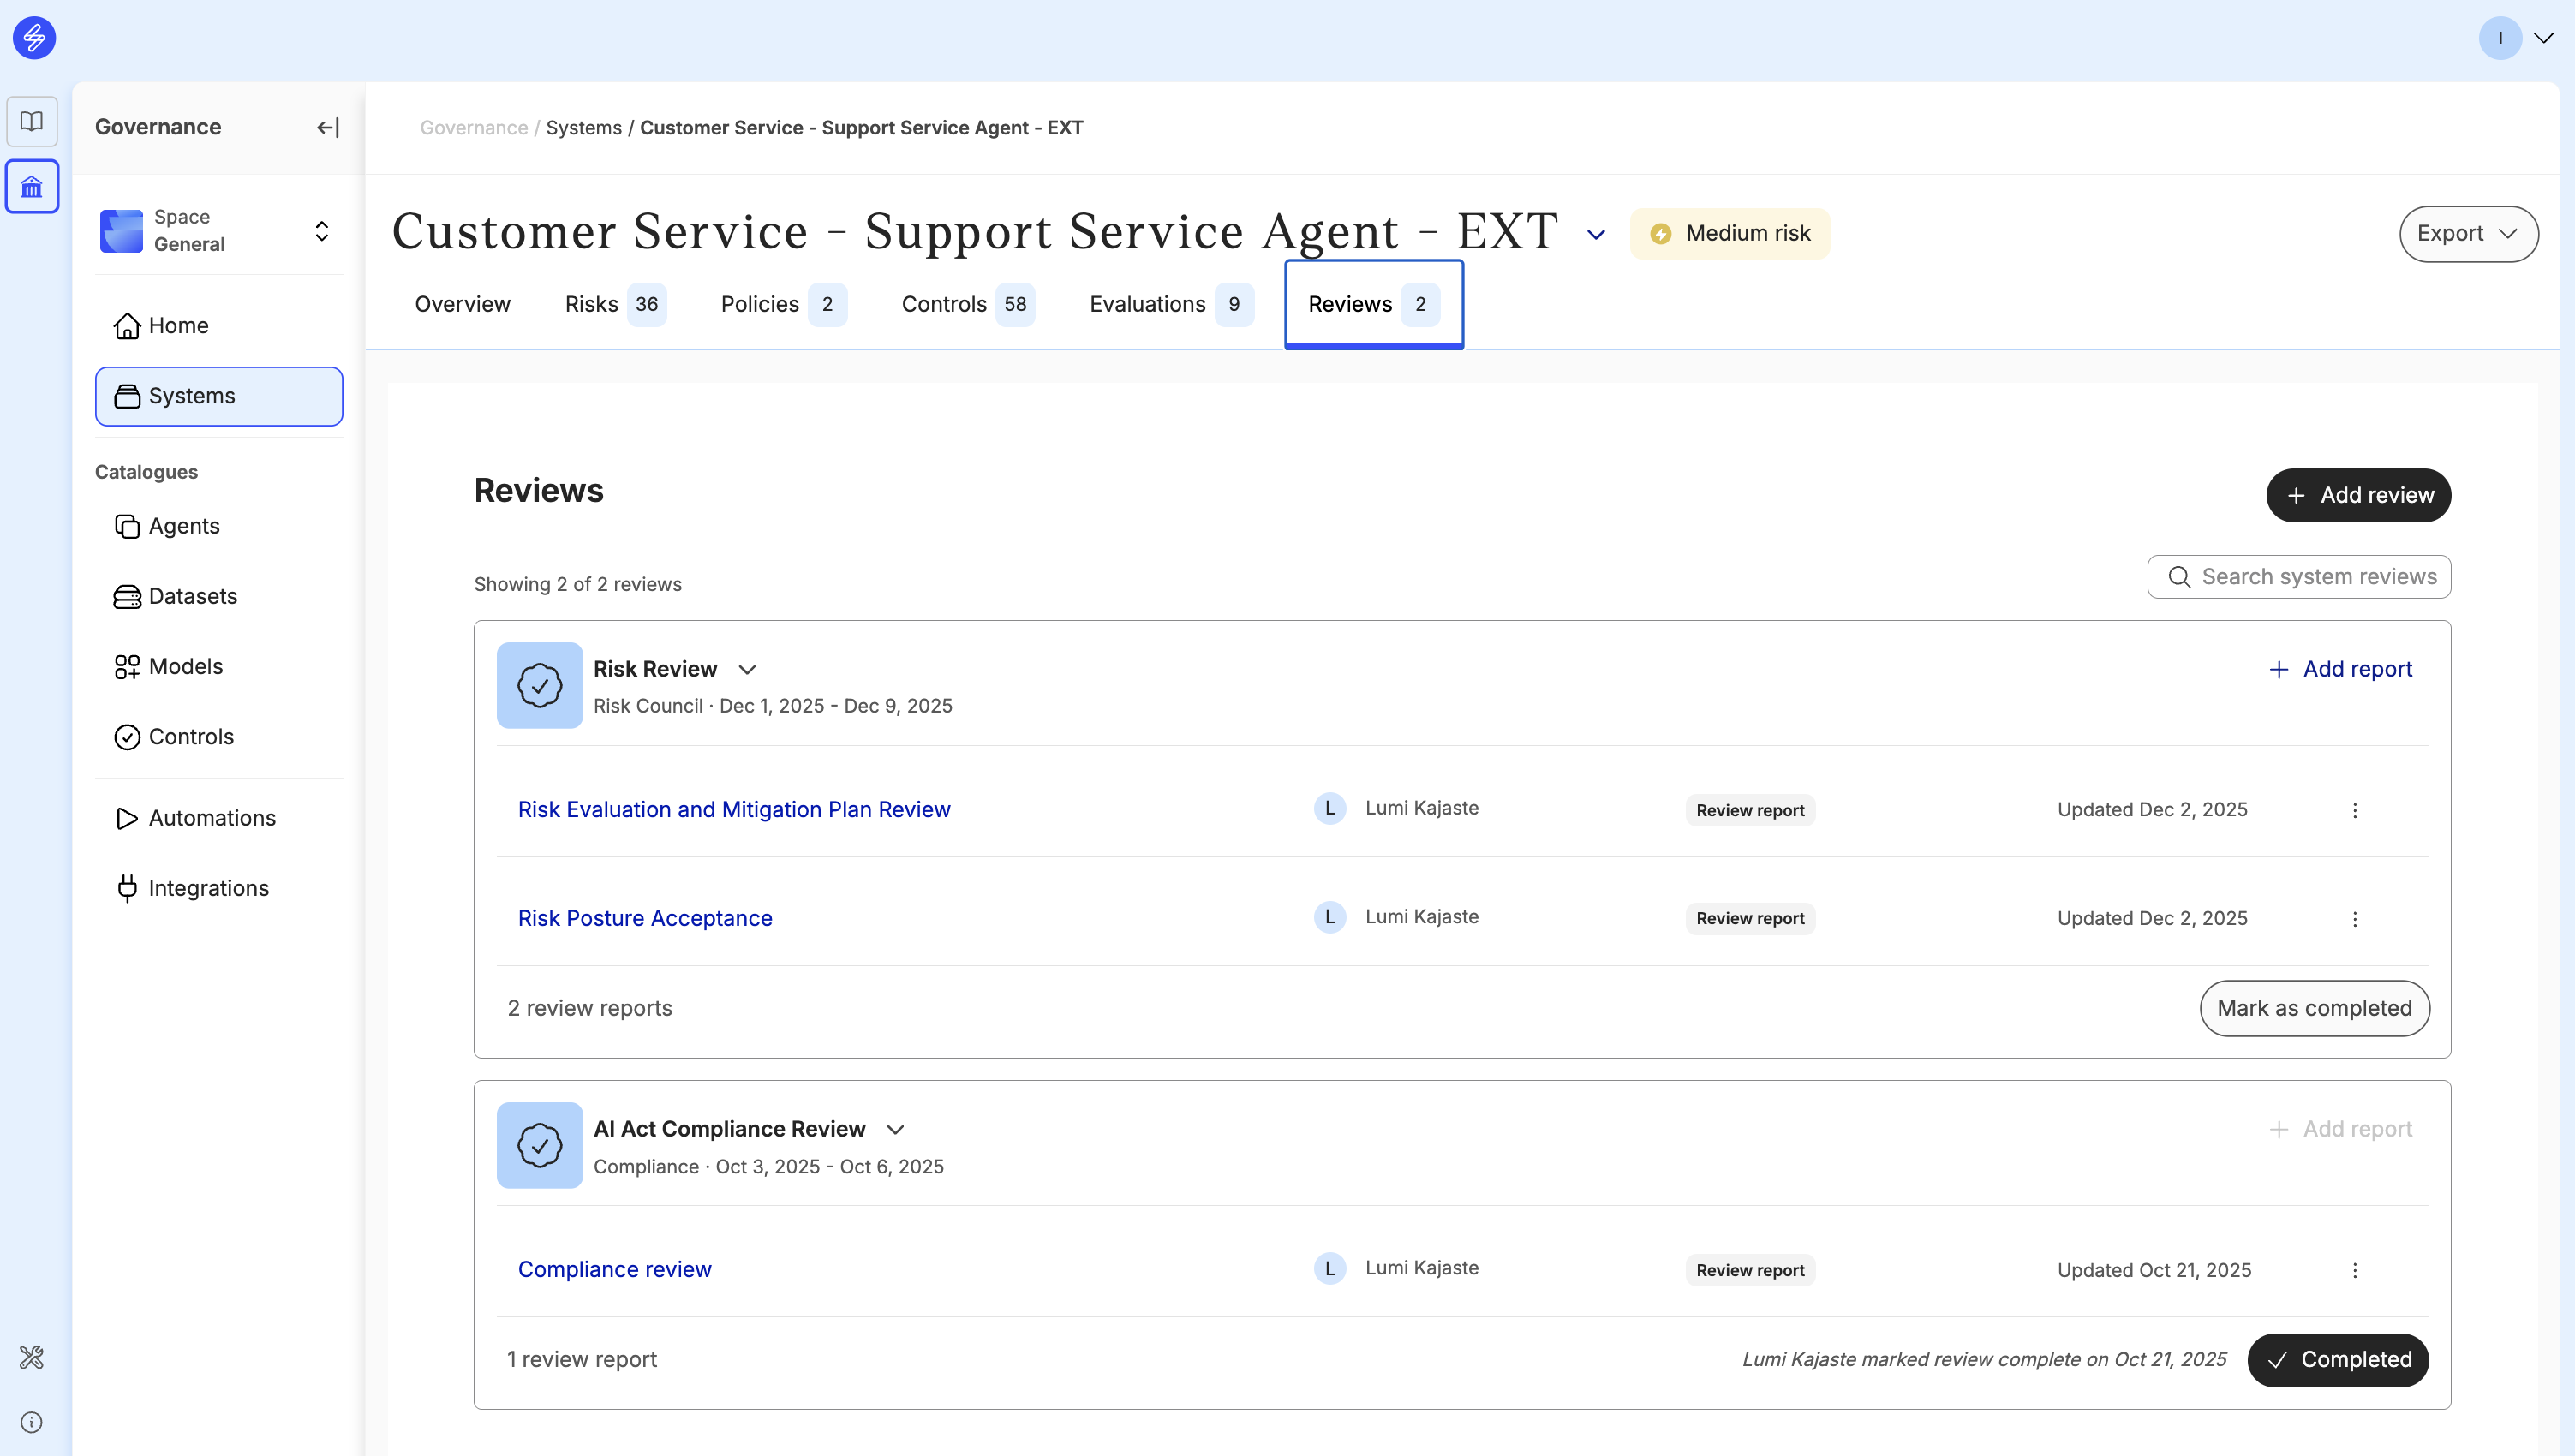
Review tab contains insights about
-
Created, scheduled and completed reviews
-
Review reports